Introduction to PyCBA#
PyCBA (Python Continuous Beam Analysis) is a general linear elastic one-dimensional beam analysis package.
This introduction demonstrates the basic use of PyCBA and results that can be obtained. So let’s get started…
[1]:
# Basic imports
import pycba as cba  # The main package
import numpy as np  # For arrays
import matplotlib.pyplot as plt  # For plotting
from IPython import display  # For images in this notebook
Example 1 - Basic Analysis#
Analyse a two span beam, with a UDL of 20 kN/m on each span
[2]:
display.Image("./images/intro_ex_1.png",width=800)
[2]:
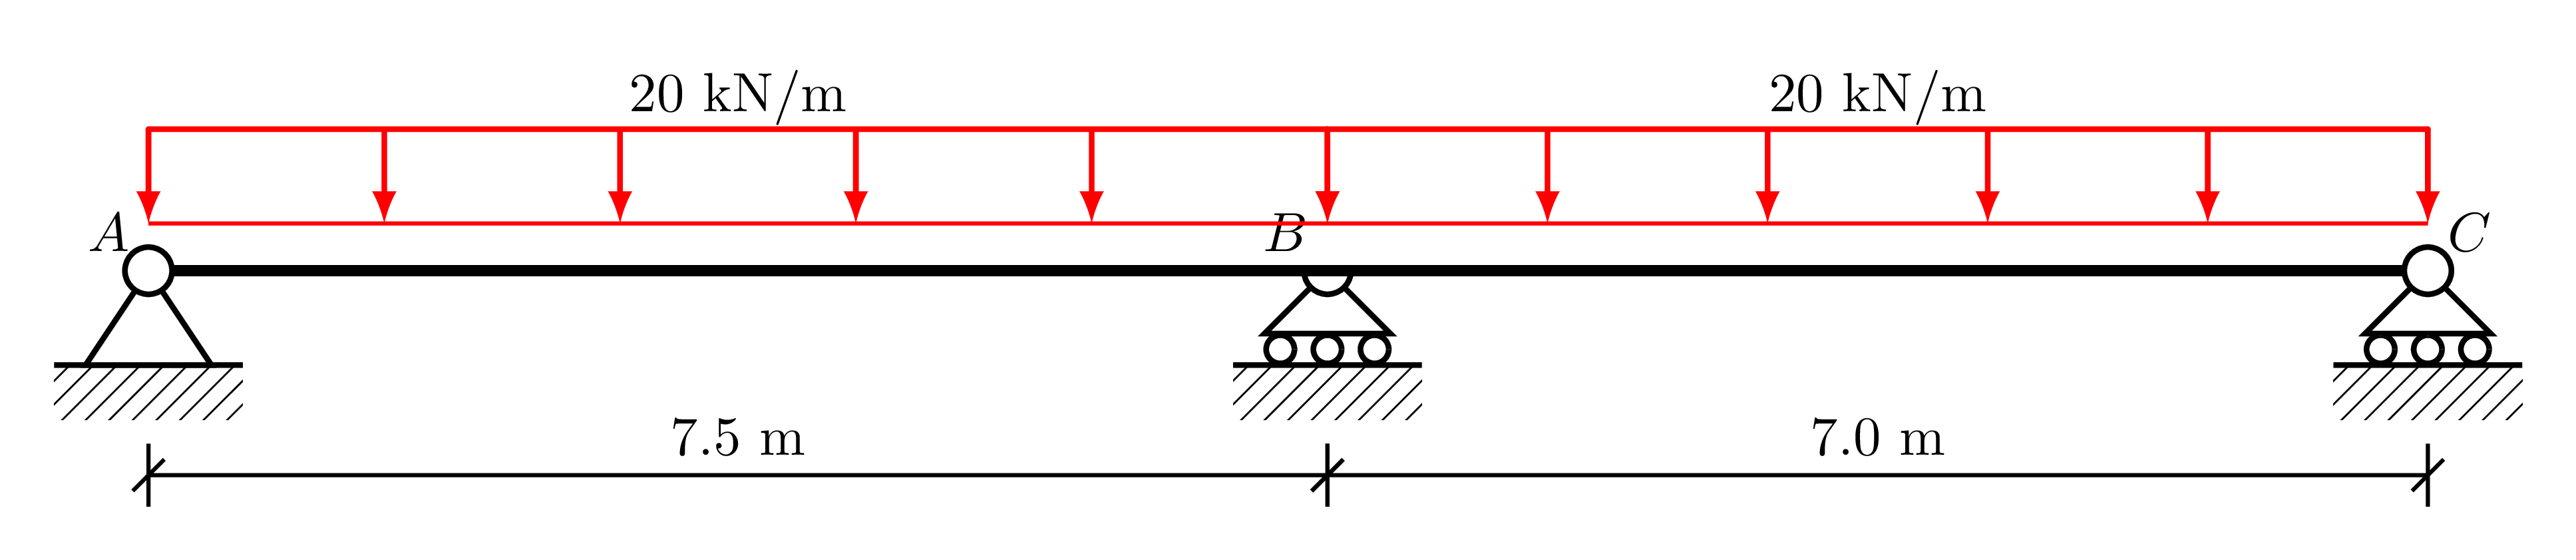
Here is the specification for PyCBA, explained below:
[3]:
L = [7.5, 7.0]
EI = 30 * 600e7 * 1e-6
supports = ["p", "r", "r"]  # one per node: A pinned, B and C rollers
Initially, we define the member lengths, which in this case coincides with the spans, \(AB\), and \(BC\).
The flexural rigidity (elastic modulus multiplied by the second moment of area) can be defined for each member, or if a scalar value is passed, this is assigned to all members. Here we take \(E = 30\) GPa and \(I = 600 \times 10^7\) mm\(^4\), and apply a conversion to put it into a consistent set of units (kN and m).
The supports are then named, one per node from left to right. All three nodes \(A\), \(B\) and \(C\) carry a vertical support: here \(A\) is a pin and \(B\), \(C\) are rollers (in a beam these are equivalent — both hold the vertical degree of freedom and leave the rotation free). Internally PyCBA stores this as a restraint vector R that lists both degrees of freedom (vertical then rotation) at every node, so with three nodes it has \(2 \times 3 = 6\) entries,
using \(-1\) for a restrained degree of freedom and \(0\) for a free one; thus supports=["p", "r", "r"] is exactly R=[-1, 0, -1, 0, -1, 0]. Either form may be passed — see the user guide for the full vocabulary, including fixed supports, free ends and springs.
With the basic variables defined, we construct the beam_analysis object by passing these variables.
[4]:
beam_analysis = cba.BeamAnalysis(L, EI, supports=supports)
Next, we add the loads for each span to this object using the add_* utility functions:
[5]:
beam_analysis.add_udl(i_member=1,w=20)
beam_analysis.add_udl(i_member=2,w=20)
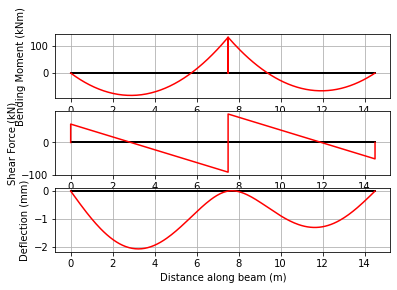
Before running the analysis it is worth visualising the beam — its supports and the applied loads — as a schematic. The underlying Beam object is available as beam_analysis.beam, which provides a plot() method (the matplotlib x-axis gives the distance along the beam):
[6]:
beam_analysis.plot_beam();
Now that we have applied the loads, it is ready for analysis and we call the analyze() function and plot the results:
[7]:
beam_analysis.analyze()
beam_analysis.plot_results();
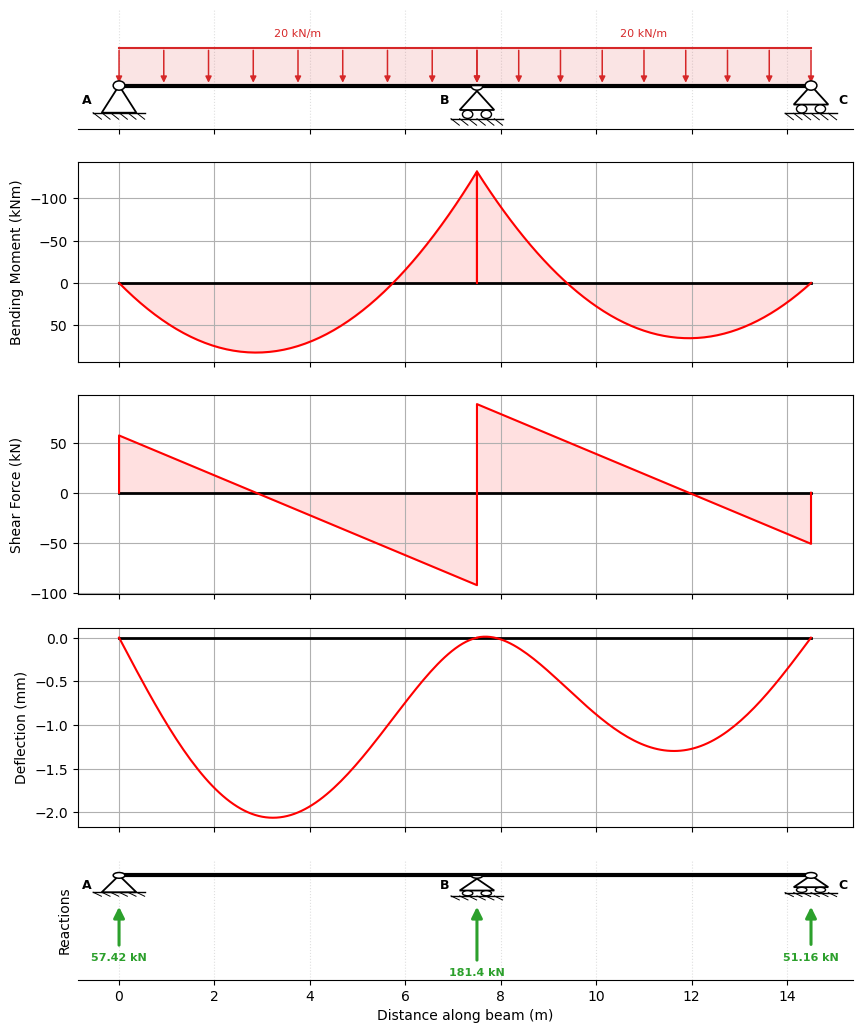
The numerical results can found from the beam_results member of beam_analysis object.
For example, the reactions corresponding to the fully-restrained nodes are:
[8]:
beam_analysis.beam_results.R
[8]:
array([ 57.41666667, 181.42261905, 51.16071429])
and the maximum bending moment along the second member, \(BC\), can be got from:
[9]:
beam_analysis.beam_results.vRes[1].M.max()
[9]:
np.float64(65.42525)
Since we have been consistent with our units, the reactions are in kN and the bending moment in kNm.
Example 2 - Load Definitions#
In this example, we consider a two-span beam with a fixed remote end, more load types, and a lower-level method for defining loads.
In addition to the utility functions for adding loads, a “load matrix” can be defined directly. This is a list of loads, where each load is defined by a list of five numbers, as defined in the docs:
Span No. | Load Type | Load Value | Distance a | Load Cover c
For UDLs covering the full length of the member, only the span number, load type, and value have non-zero entries.
[10]:
display.Image("./images/intro_ex_2.png",width=800)
[10]:

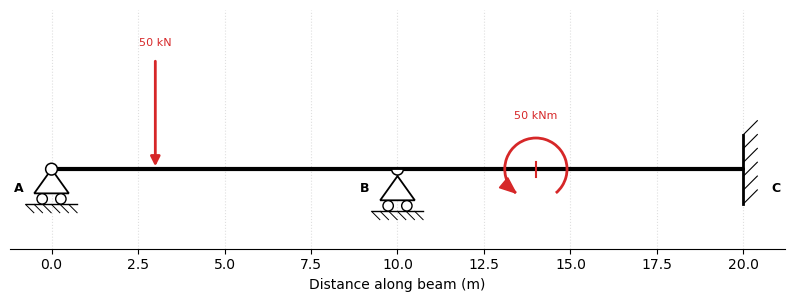
With two loads the load matrix (see pycba.load) is a list of two lists:
Span 1: point load is load type 2, with a value of \(50\) kN, at \(a = 3\) m
Span 2: moment load is load type 4, anti-clockwise positive \(50\) kNm, at \(a = 4\) m
Note, also that node \(C\) will have its two degrees of freedom restrained.
[11]:
L = [10.0, 10.0]
EI = 30 * 600e7 * 1e-6  # kNm2
R = [-1, 0, -1, 0, -1, -1]
LM = [[1, 2, 50, 3, 0], [2, 4, 50, 4, 0]]
Visualising this beam shows the point load and the applied moment, and the fixed far support at \(C\) (drawn as an encastré wall):
[12]:
cba.BeamAnalysis(L, EI, R, LM).plot_beam();
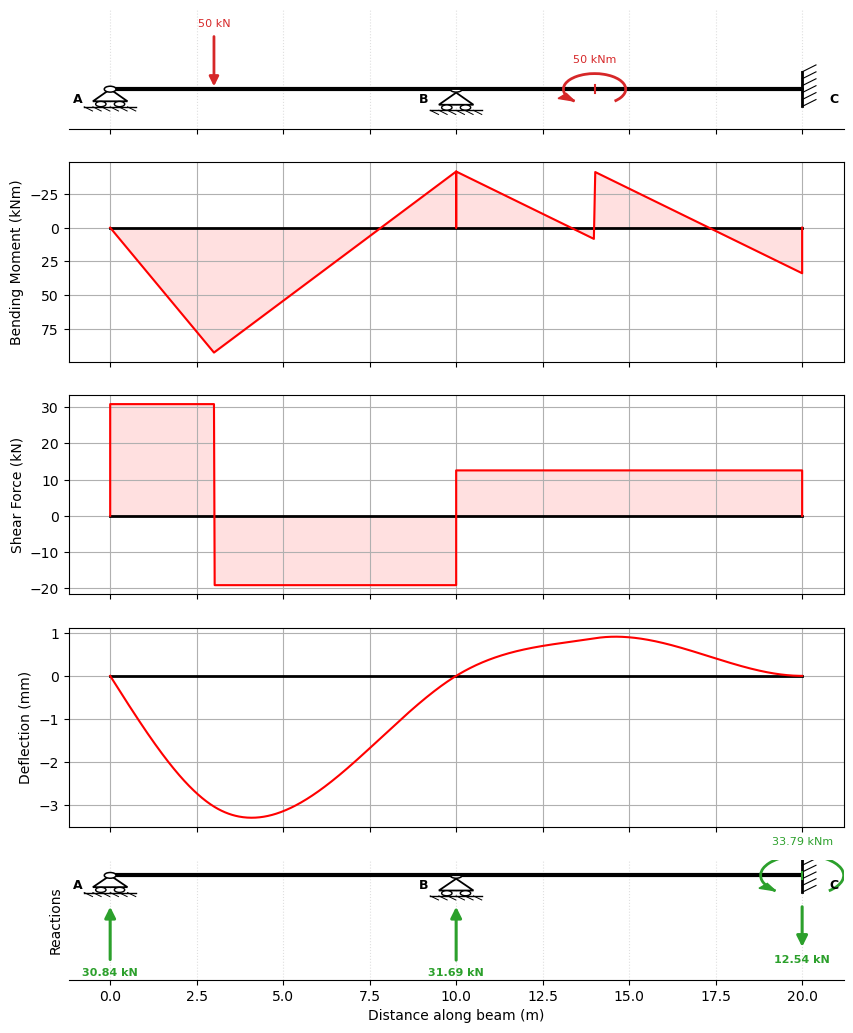
Along with L, EI, and R, the load matrix LM can be directly passed to the BeamAnalysis constructor resulting in an object ready for analysis. And to better evaluate the discontinuities for the moment and point loads, we can increase the number of evaluation points along each member to 500 when calling analyze() as follows:
[13]:
beam_analysis = cba.BeamAnalysis(L, EI, R, LM)
beam_analysis.analyze(500)
beam_analysis.plot_results();
Example 3 - 3-span beam in a building subframe#
In this example we consider a reinforced concrete building subframe in which the columns are 4 m high, and 300 mm square. We take \(E=30\) GPa Hence the roational stiffness at each joint is \(2 \times (4EI)/L\) giving
We also take the beam as \(300\times600\) giving
So we can define the beam now as usual:
[14]:
L = [6,8,6]
E = 30
I = [54e8,54e8,54e8]
R = [-1,486e9,-1,486e9,-1,486e9,-1,486e9]
[15]:
beam_analysis = cba.BeamAnalysis(L, EI, R)
Next, we add the loads for each span:
[16]:
beam_analysis.add_udl(i_member=1,w=10)
beam_analysis.add_udl(i_member=2,w=20)
beam_analysis.add_udl(i_member=3,w=10)
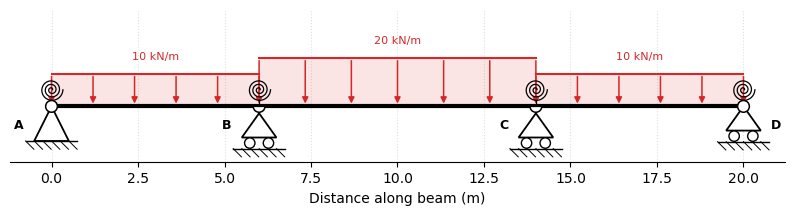
The three-span subframe with its loaded spans:
[17]:
beam_analysis.plot_beam();
Now we can analyze and plot the results:
[18]:
beam_analysis.analyze()
beam_analysis.plot_results();
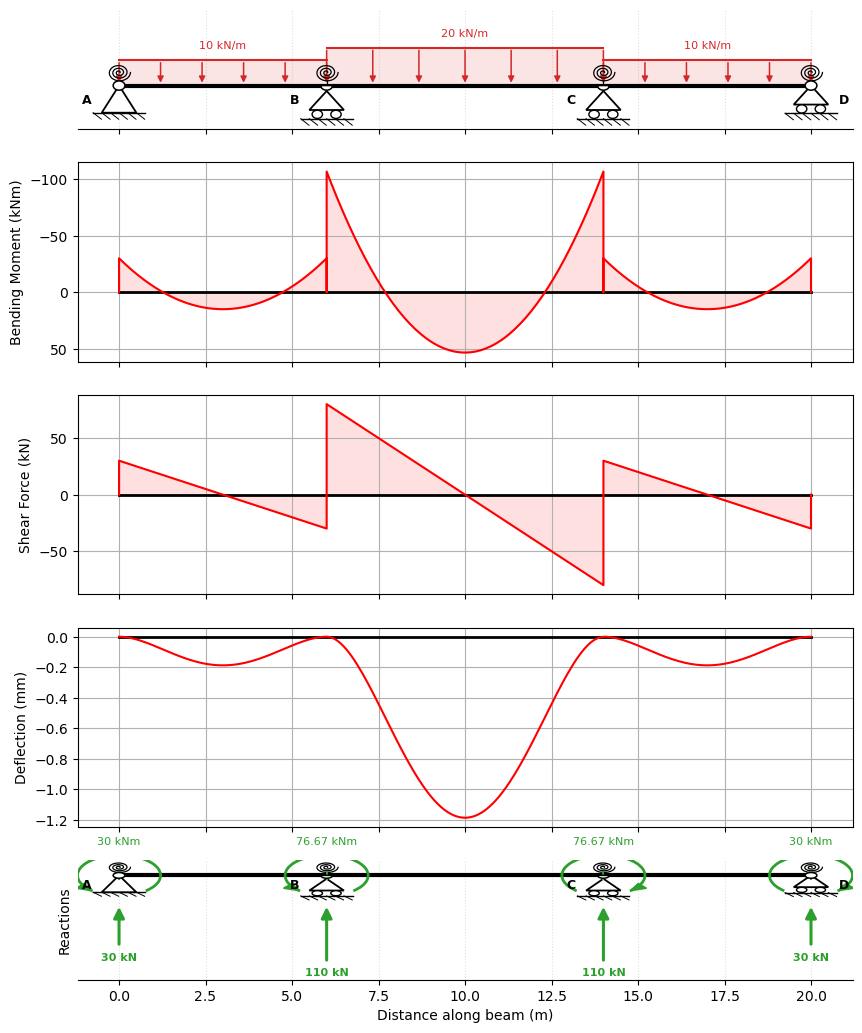
The influence of the column rotational stiffness at the joints is clear, and the moments in the columns canbe found as the difference in the moments at the ends of the connecting spans.
Example 4 - Post-tensioning: equivalent loads of a draped tendon#
A post-tensioning tendon is analysed by the equivalent load method: the draped tendon is replaced by the transverse loads it exerts on the concrete. PyCBA’s pycba.prestress preprocessor builds these loads from the tendon profile, described span by span, and returns an ordinary load matrix.
This reproduces Example 11.1 of Gilbert, Mickleborough & Ranzi (Design of Prestressed Concrete to AS3600-2009): a three-span continuous beam (400 \(\times\) 900 mm) with an end cantilever, carrying a constant prestress force \(P = 1800\) kN. The tendon is parabolic in span A-B and harped (straight, with a low point at C) in span B-D, running straight out to the cantilever tip E. Eccentricities are measured from the centroid, positive below it: 350 mm below at the midspans and 350 mm above the interior supports.
plot_tendon shows the beam, the (exaggerated) cable drape, and the equivalent balancing loads it produces. (The schematic labels the four nodes A, B, C, D in order, so GMR’s third support D appears as node C, and GMR’s tendon low point C lies inside span B-D at \(x = 29\) m.)
[19]:
import pycba as cba
from pycba.prestress import Parabola, Harp, equivalent_loads, plot_tendon

P = 1800.0                          # constant prestress force (kN)
L = [20.0, 18.0, 8.0]               # spans A-B, B-D, D-E (m)
R = [-1, 0, -1, 0, -1, 0, 0, 0]     # A, B, D pinned; E a free cantilever tip
EI = 30.0e6 * 0.4 * 0.9**3 / 12     # 400 x 900 section, E = 30 GPa (kNm^2)
beam = cba.BeamAnalysis(L, EI, R)

tendon = [
    Parabola(e_left=-0.10, e_mid=0.35, e_right=-0.35),     # A-B  (parabolic drape)
    Harp(e_left=-0.35, e_mid=0.35, e_right=-0.35, a=9.0),  # B-D  (harped, low point C)
    Harp(e_left=-0.35, e_mid=-0.20, e_right=-0.05, a=4.0), # D-E  (straight to the tip)
]
LMp = equivalent_loads(beam, force=P, profiles=tendon)   # the balancing loads
plot_tendon(beam, P, tendon);
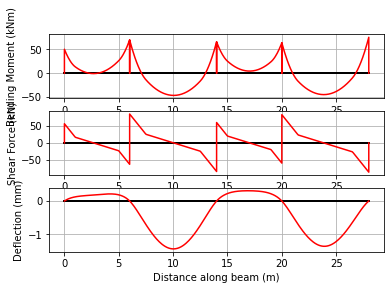
Applying those equivalent loads and analysing gives the total prestress moment \(M_p\). On a continuous beam the prestress also induces secondary (parasitic) moments: subtracting the primary moment \(P e\) leaves the secondary moment – here \(+166\) kNm over support B, matching the textbook. (The beam+loads schematic is dropped since the drape and loads are shown above.)
[20]:
import numpy as np
beam.set_loads(LMp)
beam.analyze()
beam.plot_results(show_beam=False)   # the prestress moment Mp

res = beam.beam_results.results
M = lambda x: res.M[np.argmin(abs(res.x - x))]
print("Total prestress moment Mp (cf. GMR Fig. 11.9c):")
print(f"  span A-B (x=10 m): {M(10):+.0f} kNm   [GMR -547]")
print(f"  support B (x=20 m): {M(20):+.0f} kNm   [GMR +796]")
print(f"  support D (x=38 m): {M(38):+.0f} kNm   [GMR +630]")
e_B = -0.35
print(f"At support B:  primary = {-P*e_B:+.0f} kNm,  secondary = {M(20)-(-P*e_B):+.0f} kNm   [GMR +166]")
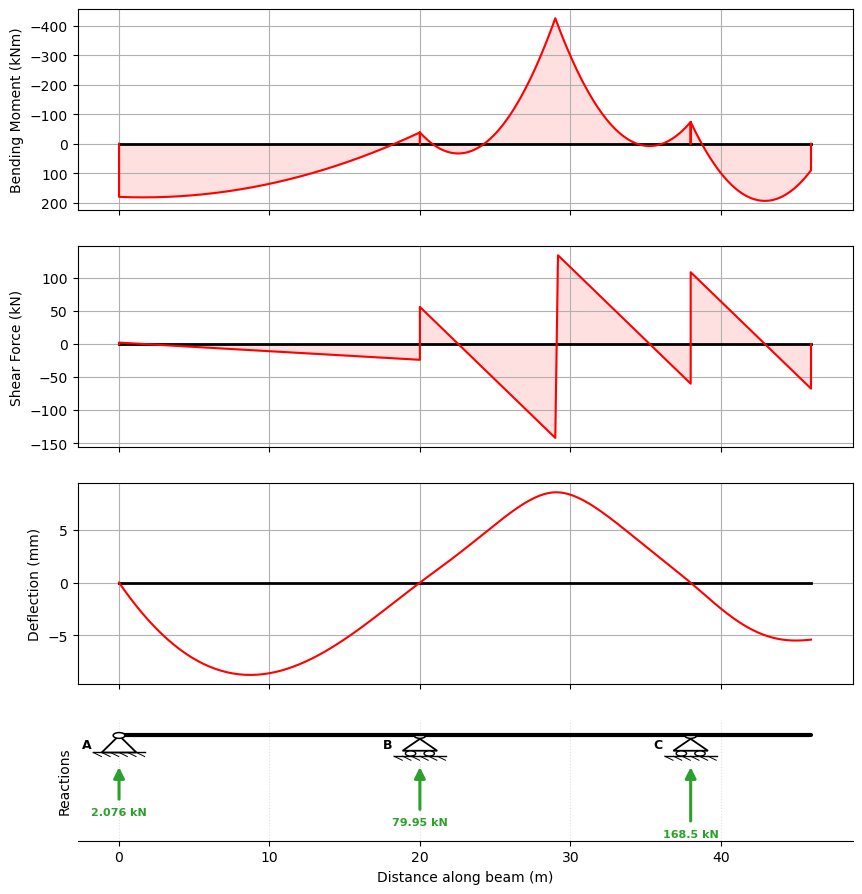
Total prestress moment Mp (cf. GMR Fig. 11.9c):
  span A-B (x=10 m): -547 kNm   [GMR -547]
  support B (x=20 m): +796 kNm   [GMR +796]
  support D (x=38 m): +630 kNm   [GMR +630]
At support B:  primary = +630 kNm,  secondary = +166 kNm   [GMR +166]
Example 5 - Load balancing: combining prestress with the applied loads#
The purpose of the drape is to balance the applied gravity loads – the upward forces from the tendon offset the downward loads, so the concrete carries mainly axial precompression. Using the same beam, tendon and prestress as Example 4, we register the dead, live and prestress loadings as named load cases (pycba.LoadCases) and let PyCBA combine and analyse them from simple factor sets – no need to assemble load matrices by hand.
Three combinations are compared: gravity alone (\(G+Q\)), at transfer (\(G+P\), just after stressing, when the prestress acts against the dead load alone), and in service (\(G+Q+P\)):
[21]:
lc = cba.LoadCases(beam)
lc.case("dead").add_all_spans_udl(beam, 12.0)   # 12 kN/m dead UDL on every span
lc.case("live").add_all_spans_udl(beam, 10.0)   # 10 kN/m live UDL on every span
lc.add_case("prestress", LMp)                    # the prestress equivalent loads

combos = {
    "gravity only   (G + Q)": {"dead": 1, "live": 1},
    "at transfer    (G + P)": {"dead": 1, "prestress": 1},
    "in service (G + Q + P)": {"dead": 1, "live": 1, "prestress": 1},
}
for name, factors in combos.items():
    res = lc.analyze_combination(factors).beam_results.results
    print(f"{name}:  peak sag {res.M.max():+6.0f} kNm   peak deflection {res.D.min()*1e3:+5.1f} mm")

lc.analyze_combination(combos["in service (G + Q + P)"]).plot_results(show_beam=False);
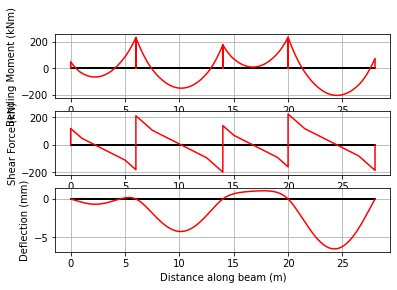
gravity only   (G + Q):  peak sag   +722 kNm   peak deflection -34.7 mm
at transfer    (G + P):  peak sag   +341 kNm   peak deflection  -0.2 mm
in service (G + Q + P):  peak sag   +194 kNm   peak deflection  -8.7 mm
The prestress relieves the gravity sagging moment from \(+722\) to \(+194\) kNm and cuts the peak deflection from \(-35\) to \(-9\) mm; at transfer the dead load is almost fully balanced (near-zero deflection). Naming the load cases lets analyze_combination build and solve each factored combination in a single call – the same machinery handles ULS factor sets such as \(1.2G + 1.5Q\).
Example 6 - Prescribed Support Settlements#
Differential settlement between supports is a common problem in structural engineering; for example, due to uneven soil stiffness, consolidation under a pier, or adjacent excavation. PyCBA handles this through the optional D parameter of BeamAnalysis.
D is a list of the same length as R. Use None for DOFs with no prescribed displacement, and a float (positive upward, negative downward) for any DOF whose displacement is known. Fixed supports (R = -1) default to zero displacement unless overridden by D.
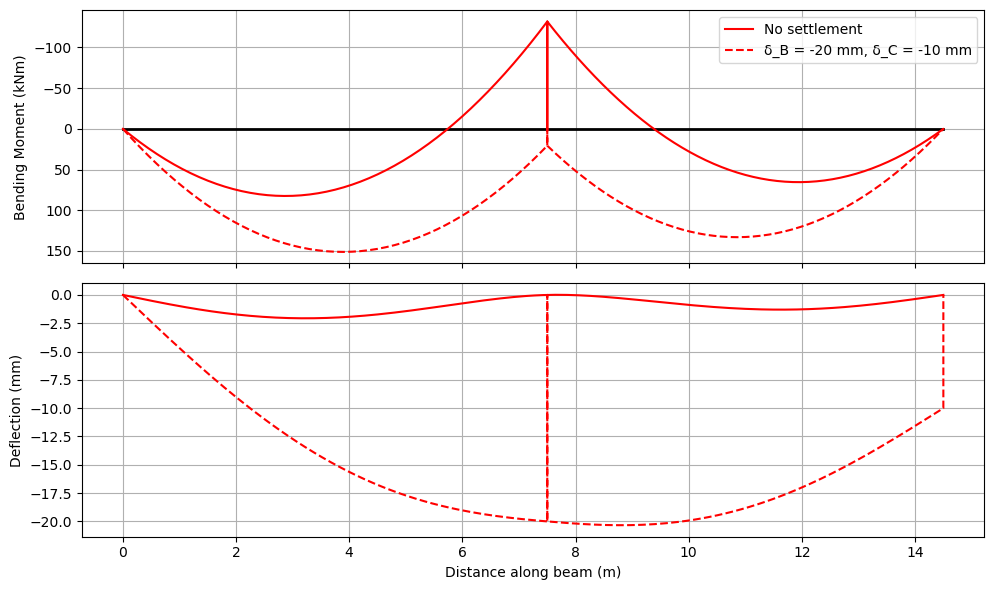
We revisit the two-span beam from Example 1, but now the intermediate support \(B\) settles by \(\delta_B = 20\) mm and the far support \(C\) settles by \(\delta_C = 10\) mm.
[22]:
L = [7.5, 7.0]
EI = 30 * 600e7 * 1e-6  # kNm^2
R = [-1, 0, -1, 0, -1, 0]
LM = [[1, 1, 20, 0, 0], [2, 1, 20, 0, 0]]

# Reference analysis – no settlement
ba_ref = cba.BeamAnalysis(L, EI, R, LM)
ba_ref.analyze()
print("Reactions (no settlement):          ", ba_ref.beam_results.R.round(3), "kN")

# Analysis with prescribed differential settlements
delta_B = -0.020   # 20 mm downward at support B (DOF 2)
delta_C = -0.010   # 10 mm downward at support C (DOF 4)
D = [None, None, delta_B, None, delta_C, None]

ba = cba.BeamAnalysis(L, EI, R, LM, D=D)
ba.analyze()
print("Reactions (with differential settle):", ba.beam_results.R.round(3), "kN")
Reactions (no settlement):           [ 57.417 181.423  51.161] kN
Reactions (with differential settle): [ 77.752 139.3    72.948] kN
The settlement redistributes bending moments across the spans. Plotting both cases makes the effect clear:
[23]:
res_ref = ba_ref.beam_results.results
res = ba.beam_results.results

fig, axs = plt.subplots(2, 1, figsize=(10, 6), sharex=True)

ax = axs[0]
ax.plot([0, sum(L)], [0, 0], "k", lw=2)
ax.plot(res_ref.x, res_ref.M, 'r', label="No settlement")
ax.plot(res.x, res.M, "r--", label=f"δ_B = {delta_B*1e3:.0f} mm, δ_C = {delta_C*1e3:.0f} mm")
ax.invert_yaxis()
ax.set_ylabel("Bending Moment (kNm)")
ax.legend()
ax.grid()

ax = axs[1]
ax.plot(res_ref.x, res_ref.D * 1e3, 'r', label="No settlement")
ax.plot(res.x, res.D * 1e3, "r--", label="With differential settlement")
ax.set_ylabel("Deflection (mm)")
ax.set_xlabel("Distance along beam (m)")
ax.grid()

plt.tight_layout()
plt.show()
Example 7 - Spring Support Reactions#
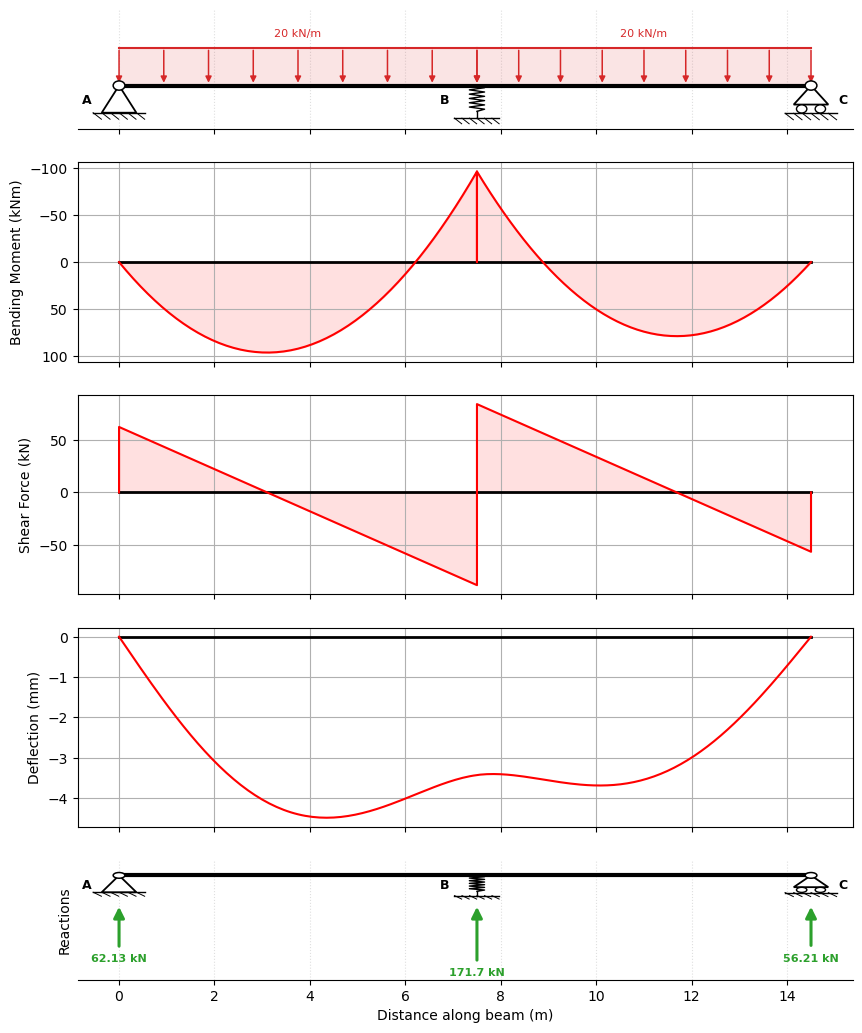
When spring supports are used instead of rigid supports (positive value in R instead of -1), running the analysis also populates beam_results.Rs — a vector of spring forces \(k_s \cdot u_i\) for each spring DOF, in the same order they appear in R. This lets you post-process foundation loads directly without back-calculating them from the nodal displacements.
We use Example 1 to illustrate.
[24]:
L = [7.5, 7.0]
EI = 30 * 600e7 * 1e-6  # kNm^2
R = [-1, 0, 5e4, 0, -1, 0]
LM = [[1, 1, 20, 0, 0], [2, 1, 20, 0, 0]]

# Reference analysis – no settlement
ba = cba.BeamAnalysis(L, EI, R, LM)
ba.analyze()
ba.plot_results();
[25]:
print(f"Reactions at A and C are: {ba.beam_results.R.round(3)} kN")
print(f"Reaction at B is: {ba.beam_results.Rs.round(3)} kN")
Reactions at A and C are: [62.125 56.206] kN
Reaction at B is: [171.669] kN