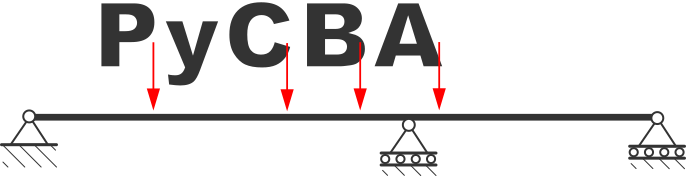
pycba.render.BeamPlotter#
- class BeamPlotter(beam, loads=None, *, load_cases=None)[source]#
Bases:
objectRender a
pycba.beam.Beamas a structural schematic.The beam structure (geometry, supports, internal hinges) is always drawn from the beam itself. The loads are an independent layer whose source is chosen with
loads:None(default) - use the beam’s own load matrix (beam.LM), which may be empty, in which case only the structure is drawn.an empty list
[]- draw the bare structure, ignoringbeam.LM.a low-level load matrix (list of PyCBA load rows).
a high-level
pycba.load_cases.LoadCase.a high-level
pycba.load_cases.LoadCombination- pass itspycba.load_cases.LoadCasescollection viaload_cases(or convert it first withcombination.to_load_case(load_cases)).
- Parameters:
beam (pycba.beam.Beam) – The beam to render. Only its geometry, restraints, element types and (optionally) load matrix are used, so the beam need not have been analysed.
loads (list | LoadCase | LoadCombination, optional) – The load source to draw (see above).
load_cases (pycba.load_cases.LoadCases, optional) – Required only when
loadsis aLoadCombination.
Methods
Draw the beam schematic with matplotlib.
Overlay support-reaction arrows on a schematic already drawn by
render_mpl()(which must have been called first, soself._usand the axis limits are set).Generate a TikZ/
stanlirepresentation of the beam.Write the TikZ/
stanlisource topath(and optionally compile it).- render_mpl(ax=None, *, dimensions=False, labels=True, load_values=True, color='tab:red', equal_aspect=True, units=None, show_supports=True, figsize=(10, 3.2))[source]#
Draw the beam schematic with matplotlib.
- Parameters:
ax (matplotlib.axes.Axes, optional) – Axes to draw into; a new figure/axes is created if omitted.
dimensions (
bool) – Draw span-length dimension lines below the beam. Off by default because the x-axis already shows distance along the beam (the extent of a partial distributed load is still dimensioned withload_values).labels (
bool) – Label the support nodesA,B, …load_values (
bool) – Annotate the load magnitudes (and the extent of any partial distributed load).color (
str) – Colour used for the load arrows/labels.equal_aspect (
bool) – Keep an equal data aspect ratio (the default) so the support and load glyphs are drawn true to shape. SetFalseto let the schematic stretch to fill its axes — used when embedding the schematic as a strip above the result diagrams (seepycba.analysis.BeamAnalysis.plot_results()).
- Returns:
The axes the schematic was drawn into.
- Return type:
matplotlib.axes.Axes
- render_reactions_mpl(ax, vert, mom, sh=None, color='tab:green', show_val=True)[source]#
Overlay support-reaction arrows on a schematic already drawn by
render_mpl()(which must have been called first, soself._usand the axis limits are set).- Parameters:
ax (matplotlib.axes.Axes) – The schematic axes to draw onto.
vert (dict[int, float]) – Node index -> vertical reaction (positive upward); drawn as a straight arrow pointing in the force direction.
mom (dict[int, float]) – Node index -> moment reaction (positive counter-clockwise); drawn as a curved arrow at the support.
sh (float, optional) – The schematic unit height; defaults to
0.05 * L.color (str) – Colour for the reaction arrows and labels.
show_val (bool) – Annotate each reaction with its magnitude.
- render_tikz(*, standalone=True, scale=None, dimensions=True, labels=True, load_values=True, units=None)[source]#
Generate a TikZ/
stanlirepresentation of the beam.- Parameters:
standalone (
bool) – IfTrue(default) return a complete compilable document; ifFalsereturn only thetikzpictureenvironment for embedding.scale (
Optional[float]) – Emit astanli\scalingfactor.dimensions (
bool) – Toggle span dimensions, node labels and load-magnitude annotations.labels (
bool) – Toggle span dimensions, node labels and load-magnitude annotations.load_values (
bool) – Toggle span dimensions, node labels and load-magnitude annotations.units (str or pycba.units.UnitSystem, optional) – Display unit system for the load and dimension labels. Defaults to the global default (see
pycba.set_units()).
- Returns:
The LaTeX source.
- Return type:
str
- save_tikz(path, *, compile=False, **opts)[source]#
Write the TikZ/
stanlisource topath(and optionally compile it).- Parameters:
path (
Union[str,Path]) – Output path; a.texsuffix is enforced.compile (
bool) – IfTruerunpdflatexin the file’s directory to produce a PDF. Requires a LaTeX installation with thestanlipackage.**opts – Forwarded to
render_tikz()(standaloneis forced toTrue).
- Returns:
The written
.texpath, or the produced.pdfwhencompileisTrue.- Return type:
Path